ETC2410/ETC5241: Introductory Econometrics Assignment 1 Sem2, 2025 | Monash University

ETC2410/ETC5241 Assignment 1
Instructions
- The assignment must be electronically submitted by 11:55pm Australian Eastern Standard Time, on Friday, 5 September 2025.
- The file needs to be uploaded in PDF format by only one member of each group.
- After Step 2, all members of the group must click the “Submit Assignment” button on Moodle and accept the University’s submission statement. This step is essential, so please make sure that you do this.
- When instructed to do so, you must report your results in equation form, with standard errors reported in parentheses below the parameter estimates. Screen shots of R (or any other statistical package) output are not acceptable. For example, the estimated regression equation below is reported in equation form with standard errors reported in parentheses below the estimated coefficients:
UN D^ER5M R = 75.459 − 0.004 GDP PC
(7.607) (0.001) - The assignment must be typed in Quarto with all analysis and graphics included as R-chunks. See the StartR website for help.
- Please attach a number to any equation or diagram that you refer to when answering the assignment questions.
- Unless otherwise instructed, all hypothesis tests should be conducted at the 5% significance level.
- If an assignment is submitted late a penalty of 5% point deduction per 24hrs late applies.
- If you are applying for special consideration for circumstances that may make you unable to engage in group work or to adhere to strict deadlines, please let us know via ETC2410.Clayton-x@monash.edu as early as possible, so that alternative arrangements can be made in time.
- A penalty of up to 10% will be imposed for failure to comply with the instructions above.
Each group member will be required to complete an anonymous peer evaluation survey. The survey will be conducted via the FeedBack Fruits app on Moodle. You will find the link to the app under the assignment submission link on Moodle. You will be asked to rate your group members’ participation and effort. The aim of the survey is to identify and address any dysfunctional groups as early as possible. The survey will also be used to adjust your assignment marks in the following manner:
- Consider hypothetical student called Arsene:
–Let n0 equal the number of (D) votes that Arsene receives from his teammates. A (D) indicates that in the opinion of his teammates Arsene has contributed nothing to the completion of the assignment.
–Let n1 equal the number of (C) votes that Arsene receives from his teammates. A (C) vote means that in the opinion of his teammates Arsene has contributed less than it was agreed by the group that he would contribute.
–Let GM equal Arsene’s group submission mark. If n0 + n1 ≥ 2, then Arsene’s mark for the
assignment is
max{0, 1 − 0.4n0 − 0.15n1} × GM
–If n0 + n1 < 2, then Arsene’s mark for the assignment will be equal to the GM . - If you fail to complete the survey by the deadline, we will assume that you have given everyone else in your group a (B) and that you have given yourself a (D).
Failure to complete the survey by the deadline will result in a loss of marks, so please complete the survey on time. It is important to communicate clearly with your group members and make sure that everyone understands what is expected from them.
Data Description
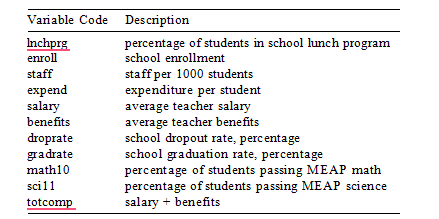
This question asks you to study the determinants of the effect of school size on student performance. The file contains data on 408 high schools from a given state for the year 1993. We can use these data to test the null hypothesis that school size has no effect on standardised test scores against the alternative that size has a negative effect. Performance is measured by the percentage of students receiving a passing score on a standardised tenth-grade math test (math10 ). School size is measured by student enrollment (enroll). Description for all the other variables is given in the table below.

Order Custom Answers for ETC2410/ETC5241 Assignment 1
Request to Buy Answer
ETC2410/ETC5241 Questions
Question 1 (20 marks)
Consider the linear regression
math10 = β0 + β1expend + u (1)
- Estimate the linear regression equation associated with (1) by OLS. Report the estimated equation in equation form with the estimated coefficients and standard errors to three decimal places. (4 marks)
- Interpret βˆ1 if expend increases by $100. (2 marks)
- Does your interpretation for βˆ1 align with what you would expect within the context? (2 marks)
- Now, estimate a linear regression equation for math10 with expend, enroll, and lnchprg as explanatory variables. Report the estimated equation in equation form with the estimated coefficients and standard errors to three decimal places. (2 marks)
- How does your interpretation for βˆ1 in the regression equation estimated in Question 1(d) change compared to your interpretation for βˆ1 in the regression equation estimated in Question 1(a)? (2 marks)
- Now, interpret the coefficient on enroll in 1(d) if student enrollment increases by 1,000. Does the sign make sense to you? If yes, why? (4 marks)
- Based on the reported p-values for the regression estimated in 1(d), are any of the regressors individually significant at the 5% significance level? Briefly explain. (2 marks)
- What are some other factors that could be used to explain math10 (at the school level)? (2 marks)
Question 2 (20 marks)
Consider the linear regression equation for math10 with expend, enroll, and lnchprg as predictors. Conduct all tests at the 5% significance level.
- Test the hypothesis that the percentage of students in school lunch program has no effect on average pass rates, once we control for school expenditure and school enrollment against the alternative that it has a negative effect. State the null and alternative hypotheses, the form and sampling distribution of your test statistic under the null, the sample and critical values of your test statistic, your decision rule and your conclusion. (6 marks)
- Test the hypothesis that school enrollment and percentage of students in school lunch program has no effect on the math pass rates against the alternative that it has an effect. Specify the unrestricted and restricted models. State the null and alternative hypotheses, the form and sampling distribution of your test statistic under the null, the sample and critical values of your test statistic, your decision rule and your conclusion. (8 marks)
- Test the joint significance of the regressors. State the null and alternative hypotheses, the form and sampling distribution of your test statistic under the null, the sample and critical values of your test statistic, your decision rule and your conclusion. (6 marks)
Question 3 (20 marks)
Consider the linear regression equation for math10 with expend, enroll, and lnchprg as predictors. Conduct all tests at the 5% significance level.
- Derive a model to test the null hypothesis that expenditure per student has the same effect on math pass rates as school enrollment, against the alternative hypothesis that expenditure per student has a larger effect. (5 marks)
- Use the model you derived in Question 3(a) to test the null hypothesis specified in Question 3(a). State the null and alternative hypotheses, the form and sampling distribution of your test statistic under the null, the sample and critical value of your test statistic, your decision rule and your conclusion. (6 marks)
- Derive a model to test the null hypothesis that expenditure per student has the same effect on math pass rates as school enrollment, against the alternative hypothesis that the effects are different, using an F-test. (3 marks)
- Use the model you derived in Question 3(c) to test the null hypothesis specified in Question 3(c). State the null and alternative hypotheses, the form and sampling distribution of your test statistic under the null, the sample and critical value of your test statistic, your decision rule and your conclusion. (6 marks)
Question 4 (20 marks)
- Consider the linear regression equation for math10 with expend, enroll, and lnchprg as predictors. Extend this linear regression equation to allow for the possibility that the marginal effect of student enrollment on math pass rate varies by whether a school has more than 100 staff members per 1000 students or not. Write down the extended model. (4 marks)
- Estimate the extended linear regression equation by OLS. Report the estimated equation in equation form with the estimated coefficients and standard errors to three decimal places. (4 marks)
- Test whether a school has more than 100 staff members per 1000 students or not has an effect on math10 in the regression equation in question 4(b). Specify the unrestricted and restricted models. State the null and alternative hypotheses, the form and sampling distribution of your test statistic under the null, the sample and critical values of your test statistic, your decision rule and your conclusion. (8 marks)
- Using the estimated extended regression model in 4(b), derive the predicted percentage of students passing 10th grade math exam for two schools: both spend an average of $5,332 per student, 4,046 student enrollment, with 5.5% of students receiving school lunch, and the first school has 90 staff members per 1000 students whereas the second school has 120 staff members per 1000 students. (4 marks)